GBP/USD 5M
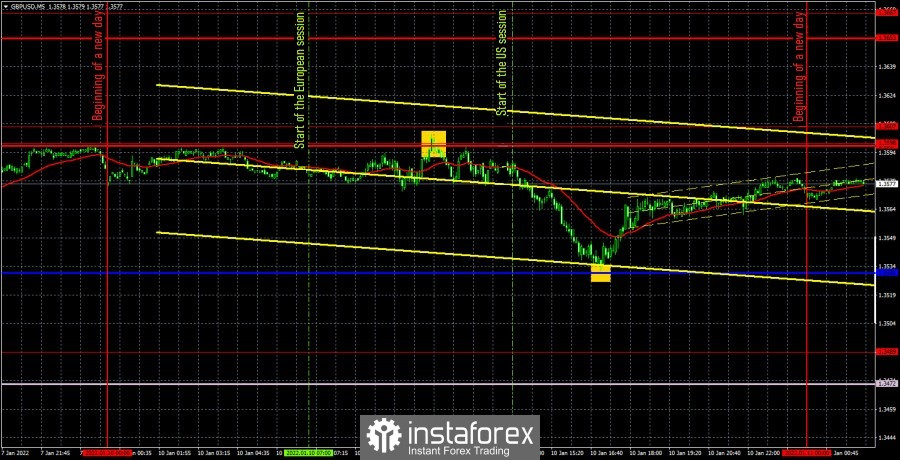
The GBP/USD currency pair moved much better than EUR/USD on Monday. And the trading signals were much more profitable and clear. Although, in general, the pound/dollar repeated the movements of the euro/dollar pair, since it also fell for most of the day without good fundamental or macroeconomic reasons. However, the British currency maintains an upward trend on the hourly timeframe, so a decline of 75 points looks just like a correction, after which the main movement will resume. But at the same time, the corrective movement may continue, since the previous growth was very strong. And the euro/dollar pair remains in the horizontal channel at this time. Now let's look at the trading signals. In principle, there were only two of them on Monday. And both are just perfect in accuracy. The first sell signal was formed near the level of 1.3598 (rebound) and at this moment traders had to open short positions. Subsequently, the price went down 60 points and stopped only near the critical Kijun-sen line, from which it also bounced. This rebound is clearly visible on the 4-hour timeframe, from where the lines of the Ichimoku indicator are transferred to the current chart. According to this rebound, it was necessary to close short positions in profit of about 50 points and it was even possible to open long positions, since it was not too late yet, and the signal turned out to be very strong. As a result, it was possible to earn about 20 more points on a long position. In total, the pound made a profit of 70 points, which covered the losses that were received on the euro/dollar pair. In principle, Monday, despite the empty calendars of macroeconomic events, turned out to be a very positive day.
We recommend you to familiarize yourself:
Overview of the EUR/USD pair. January 11. The week began very calmly for the European currency.
Overview of the GBP/USD pair. January 11. The UK continues to set sad anti-coronavirus records.
Forecast and trading signals for EUR/USD for January 11. Detailed analysis of the movement of the pair and trade deals.
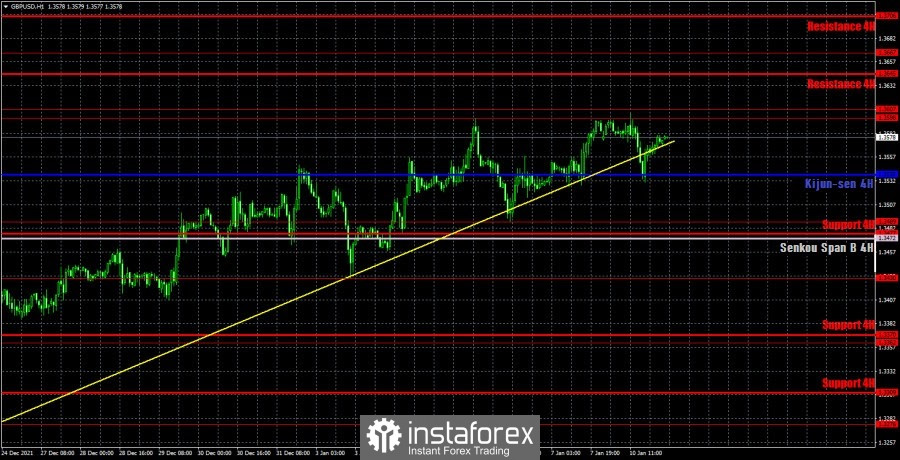
GBP/USD 1H

On the hourly timeframe, the pound/dollar pair continues its upward movement, although it previously settled below the ascending trend line. However, there is a very important point: the pair could not overcome the level of 1.3598, from which it bounced just a couple of days ago. Thus, the 1.3598 level showed its strength and ability to stop the upward trend. Therefore, we expect a new round of downward correction in the coming days. Yesterday, the pair bounced off the critical line, but today it can overcome it. We highlight the following important levels on January 11: 1.3430, 1.3489, 1.3598-1.3607, 1.3667. The Senkou Span B (1.3472) and Kijun-sen (1.3539) lines can also be signal sources. Signals can be "bounces" and "breakthroughs" of these levels and lines. It is recommended to set the Stop Loss level to breakeven when the price passes in the right direction by 20 points. The lines of the Ichimoku indicator can move during the day, which should be taken into account when determining trading signals. There are no interesting events and publications planned for Tuesday in the UK, but Federal Reserve Chairman Jerome Powell's speech in Congress will take place in the US, which can be very interesting. Especially if the head of the Fed adheres to the same hawkish line that was in the minutes of the December Fed meeting. Anyway, we are waiting for a new strengthening of the US currency. And the dollar can rise without Powell, just like it did on Monday.
Explanations for the chart:
Support and Resistance Levels are the levels that serve as targets when buying or selling the pair. You can place Take Profit near these levels.
Kijun-sen and Senkou Span B lines are lines of the Ichimoku indicator transferred to the hourly timeframe from the 4-hour one.
Support and resistance areas are areas from which the price has repeatedly rebounded off.
Yellow lines are trend lines, trend channels and any other technical patterns.
Indicator 1 on the COT charts is the size of the net position of each category of traders.
Indicator 2 on the COT charts is the size of the net position for the non-commercial group.