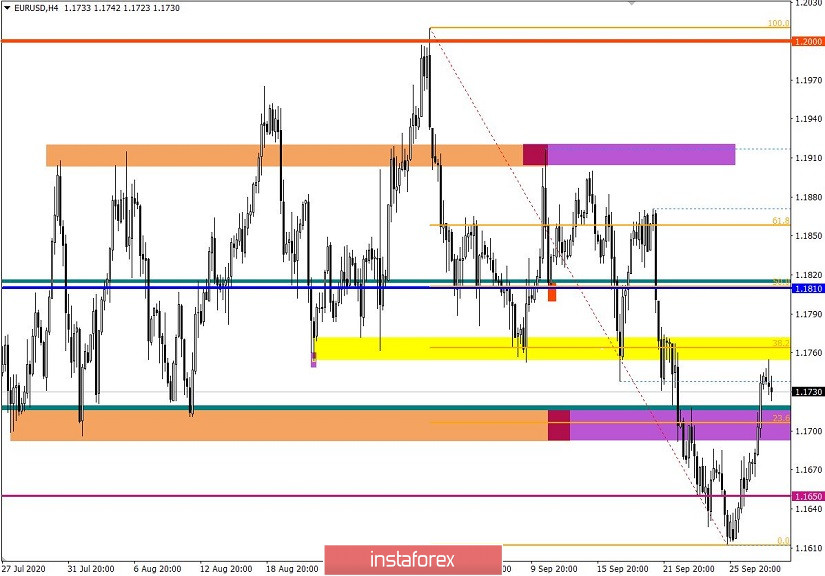
The EUR / USD pair formed an impressive correction of more than 140 points from the local low of 1.1612 during the past days. As a result, the quote returned once again to the boundaries of the previously passed side channel 1.1700 / 1.1810 / 1.1910, but market participants are inclined to further decline.
The correction move was preceded by the previously known level of 1.1755, which played the role of interaction of trade forces on August 21, September 9 and 17. In this case, it also affects the quote, resulting in a slowdown.
It should be considered that the pattern of the side channel has already been changed at the time of the breakdown of its lower limit, thus the chance of another decline below 1.1700 is quite high.
Analyzing yesterday's fifteen-minute time frame, you can see that the round of long positions appeared during the start of the European session and lasted until the end of the trading day.
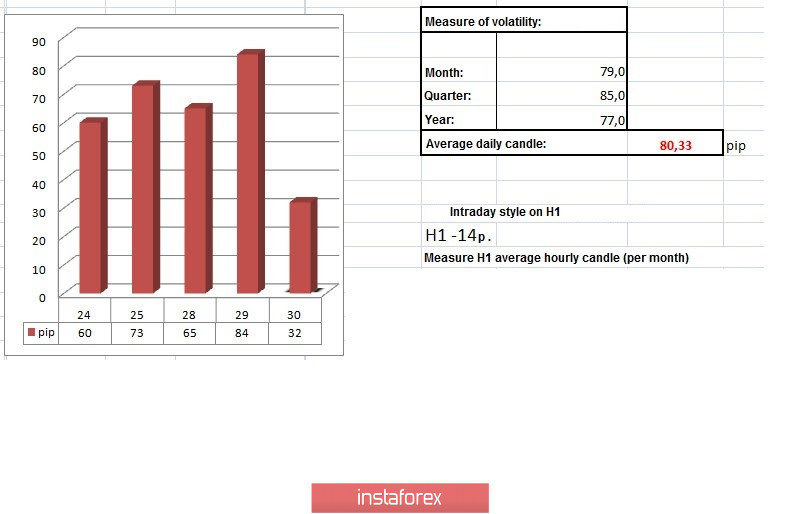
In terms of daily dynamics, we have the highest volatility in six trading days. It was 84 points, which is 4% above the average.
As discussed in the previous review, traders did not exclude the possibility of holding a corrective move in the event of a price consolidation above 1.1720.
Considering the trading chart in general terms (daily period), you can see that two corrections were recorded during September, where the current one was a field of updating the local low.
Yesterday's news background did not have any significant statistical data once again on the EU and US.
For the informational background, the head of the Dallas Fed, Robert Kaplan, commented on the topic of interest rates, where he believes that the Fed should continue to keep the rate at the current level, around zero, until the economy starts to recover by the end of 2022 or 2023.
He said that there are real costs involved in keeping rates at zero for a long period of time, including excessive risk taking and distortions in financial markets.
It is worth considering that they are currently turning a blind eye to many economic problems in the US, including the second wave of COVID-19, but as soon as the presidential elections are held, everything can change radically.
In terms of the economic calendar, we have an ADP report on the level of employment in the US private sector today, where it is expected to grow by 610 thousand, which is to 428 thousand last month. The recovery in the labor market may please investors and positively affect the US dollar. At the same time, they will publish the final data on US GDP for the second quarter, where they should confirm the fact of the economic recession by -9.1% in annual terms. On a quarterly basis, a decline of -31.7% is expected. Considering that such terrible indicators have already been given in preliminary estimates, the market has already considered such negativity and all attention will be focused on the ADP report.
USA 12:15 Universal time - ADP report on the level of employment in the private sector for September
USA 12:30 Universal time - GDP (Q2)
Further development
Analyzing the current trading chart, you can see a slowdown in the correction movement around the level of 1.1755, where the initial price rebound occurred. We can assume that if the price is consolidated below the side channel 1.1700 // 1.1810 // 1.1910, a decline will most likely occur, which will lead to a weakening of the European currency and a decline to 1.1650-1.1600 in the future.
An alternative scenario will be considered if the correction move is held, where price consolidation above 1.1775 may lead to the end of the downward cycle from September 1.
Indicator analysis
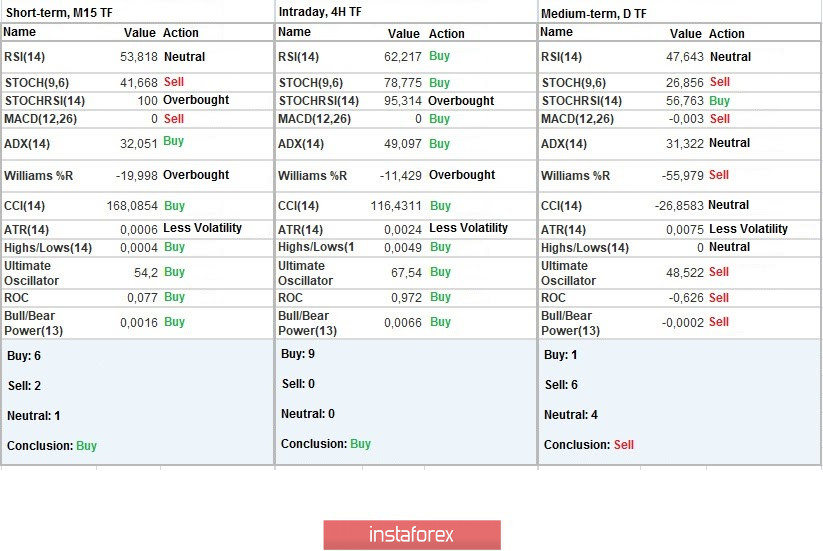
Analyzing different sectors of time frames (TF), we see that the indicators of technical instruments on the minute and hourly TF signal a buy due to the corrective move and price consolidation within the limits of the previous channel. The daily TF, in turn, signals a sell due to the scale of the September decline.
Weekly volatility / Volatility measurement: Month; Quarter; Year
Measurement of volatility reflects the average daily fluctuation, calculated per Month / Quarter / Year.
(It was built considering the time the article is published)
The volatility of the current time is 32 points, which is 60% below the average. It will grow due to the information and news flow.
Key levels
Resistance zones: 1.1755 *; 1.1910 **; 1.2000 ***; 1.2100 *; 1.2450 **; 1.2550; 1.2825.
Support zones: 1.1700 1.1650 *; 1.1500; 1.1350; 1.1250 *; 1.1180 **; 1.1080; 1.1000 ***.
* Periodic level
** Range level
*** Psychological level