When to go long on EUR/USD:
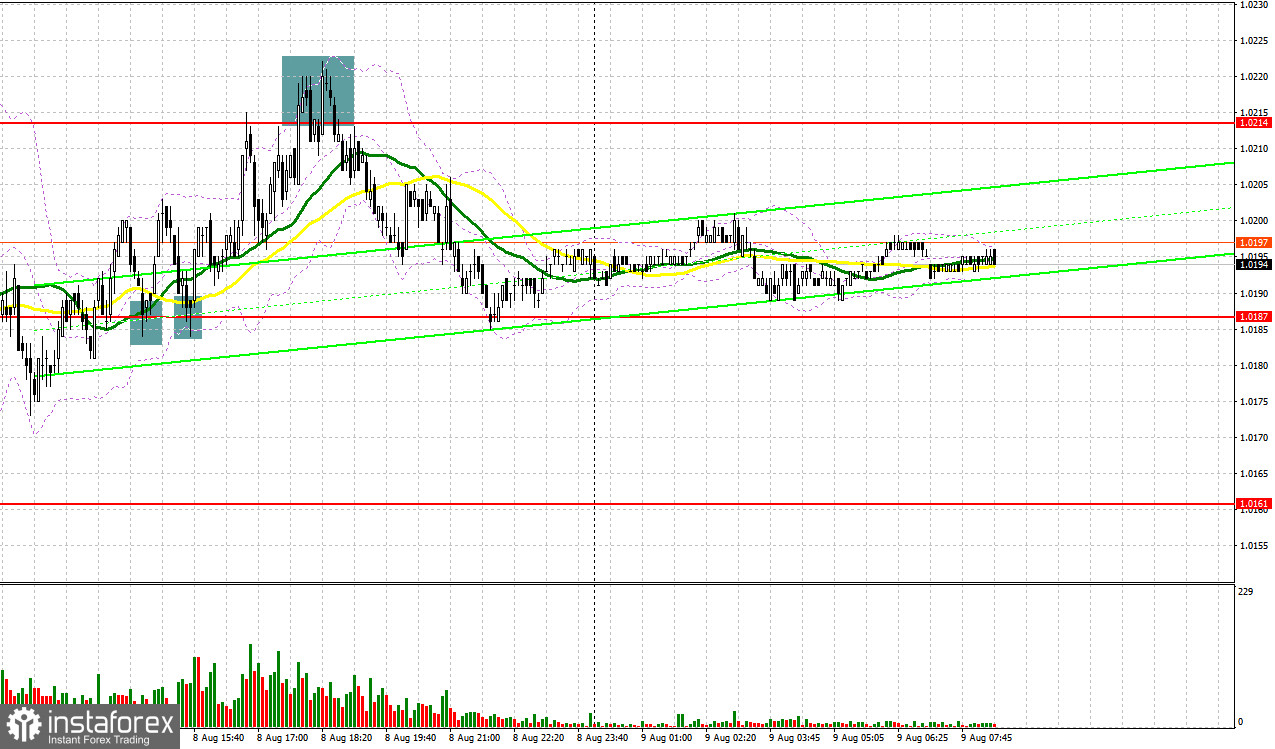
Several excellent market entry signals were formed yesterday. I suggest you take a look at the 5-minute chart and figure out what happened. I paid attention to the 1.0191 level in my morning forecast and advised you to make decisions on entering the market. Considering that we did not have statistics in the first half of the day, and the day as a whole promised to be positive, an unsuccessful consolidation above 1.0191 on the reverse test after the breakthrough - all this led to a sell signal, but it never came to a major drop in the pair during Friday's trend. As a result, after falling by 17 points, the demand for the euro returned. The bulls managed to cling to 1.0191 closer to the second half of the day, forming a buy signal there. It amounted to more than 30 points, but the bears did not make it possible for the pair to settle above 1.0214. As a result, a sell signal on a false breakout and the pair's return to 1.0187 – about 30 more points of profit.
COT report:
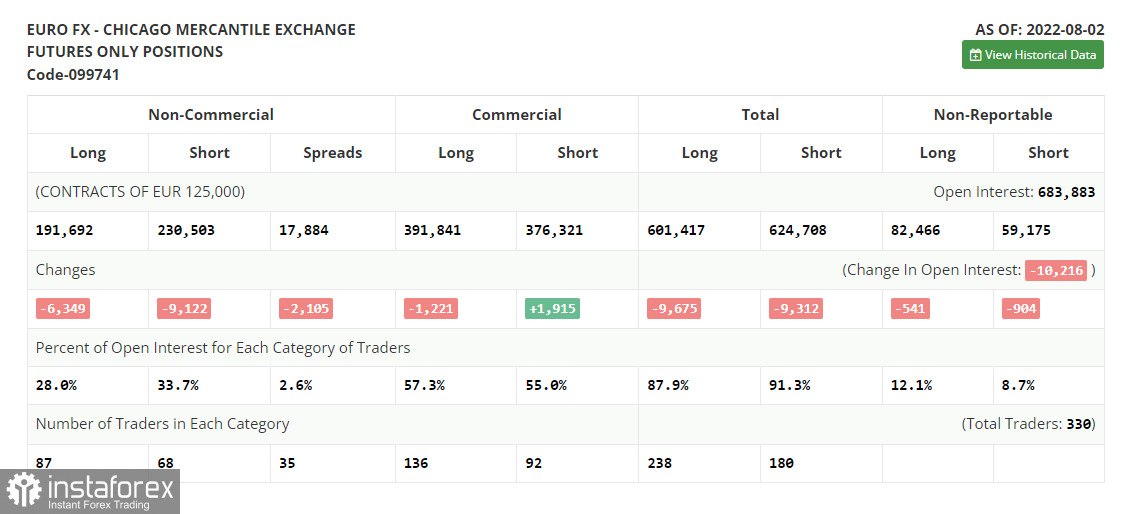
Before talking about the further prospects for the EUR/USD movement, let's look at what happened in the futures market and how the Commitment of Traders positions have changed. The Commitment of Traders (COT) report for August 2 logged a sharp decline in both short and long positions, but the decline of the latter turned out to be greater, which continues to indicate the gradual end of the bear market and an attempt to find a market bottom after reaching parity for the euro against the US dollar . Last week, the statistics on the eurozone were not as pleasing, which cannot be said about the data on the US and a strong labor market, which once again reminded investors that even in conditions of high inflation, the US economy can confidently survive the impending recession and high interest rates. The decline in the positions of bulls and bears can rather be attributed to the summer period. The activity of traders may become even lower in August and this should not be surprising. In the near future, we will find out how things are going with inflation in the US and whether the recent aggressive hikes in the key interest rate by the central bank have benefited. If inflation in the US begins to decline, this will be a clear reason to build up long positions in risky assets. The COT report indicates that long non-commercial positions decreased by 6,349 to 191,692, while short non-commercial positions decreased by 9,122 to 230,503. At the end of the week, the overall non-commercial net position, although it remained negative, rose slightly from -41,584 to -39,811, which indicates a continuation of the market turning towards euro bulls. The weekly closing price increased and amounted to 1.0206 against 1.0161.
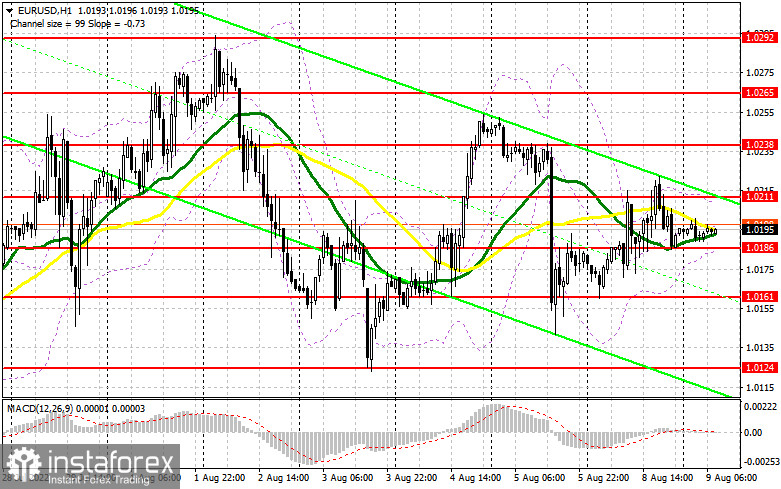
Today, everything promises to be sideways just like yesterday: bulls will buy on expectations of a reduction in inflation in the United States, which we will only find out tomorrow, and speculators will take advantage of this moment and sell euros within the day, getting on the nerves of investors. Most likely yesterday's picture with a sharp rise and the same sharp fall of the euro will be repeated. This is all due to the lack of fundamental statistics and low trading volume. Today, there is nothing again in the eurozone that could somehow seriously affect the pair's direction, so I advise you to stick to yesterday's scenario. If the pair goes down, forming a false breakout in the area of 1.0187, from which the euro has already bounced up yesterday, will provide another signal to open long positions in hopes of building an upward trend with the prospect of updating the resistance of 1.0211. A breakthrough and test from top to bottom of this range will enable you to get out of the formed triangle, which will hit the bears' stops, forming another signal to enter longs with the possibility of a larger move up to 1.0238. The farthest target will be the area of 1.0264, where I recommend taking profits.
If the EUR/USD declines and there are no bulls at 1.0186, the pressure on the pair will increase, which will lead to a breakdown of the lower boundary of the triangle and open the way to 1.0161. I recommend buying only on a false breakout from this level. If there is no one there, I advise you to postpone long positions until the lower border of the wide horizontal channel at 1.0124. But the best option for opening longs from there would also be a false breakout. I advise you to buy EUR/USD immediately on a rebound only from 1.0082, or even lower - in the area of 1.0045, counting on an upward correction of 30-35 points within the day.
When to go short on EUR/USD:
Yesterday, the bears fought back against the bulls, but the renewal of the daily high quite significantly tipped the scales in favor of euro bulls, who are just waiting for tomorrow's US inflation report. It is obvious that bears are ready to act only on growth, fighting off bulls, since active actions have not yet been observed when approaching significant support levels - this is bad. A good option to sell today is a false breakout in the nearest resistance area of 1.0211. All this will lead to the euro moving down to the area of 1.0186, and the breakdown and consolidation below this range, as well as the reverse test from the bottom up - create another sell signal with the removal of bulls' stop orders and a larger movement of the pair to the area of 1.0161. Consolidating below this area is a direct road to 1.0124, where I recommend completely leaving short positions. A more distant target will be the area of 1.0082.
If EUR/USD moves up during the European session, as well as the absence of bears at 1.0211, we can safely put an end to Friday's bear market. Then I advise you to postpone shorts on the euro to 1.0238. Forming a false breakout there will be a new starting point for entering shorts. You can sell EUR/USD immediately for a rebound from the high of 1.0264, or even higher - from 1.0323, counting on a downward correction of 30-35 points.
Indicator signals:
Moving averages
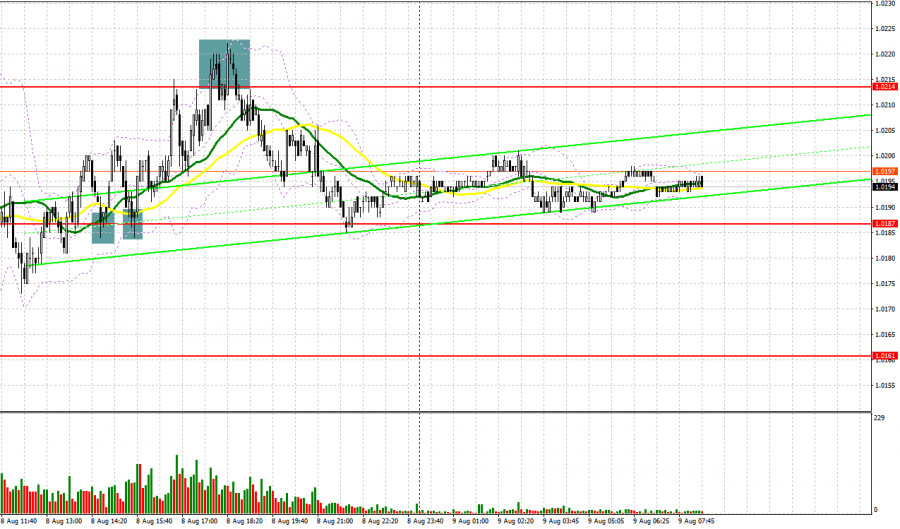
Trading is conducted in the region of 30 and 50 moving averages, which indicates market uncertainty with the succeeding direction.
Note: The period and prices of moving averages are considered by the author on the H1 hourly chart and differs from the general definition of the classic daily moving averages on the daily D1 chart.
Bollinger Bands
A breakthrough of the lower border of the indicator in the area of 1.0186 will lead to a decline for the euro. Surpassing the upper limit of the indicator in the area of 1.0211 will lead to the euro's growth.
Description of indicators
- Moving average (moving average, determines the current trend by smoothing out volatility and noise). Period 50. It is marked in yellow on the chart.
- Moving average (moving average, determines the current trend by smoothing out volatility and noise). Period 30. It is marked in green on the chart.
- MACD indicator (Moving Average Convergence/Divergence — convergence/divergence of moving averages) Quick EMA period 12. Slow EMA period to 26. SMA period 9
- Bollinger Bands (Bollinger Bands). Period 20
- Non-commercial speculative traders, such as individual traders, hedge funds, and large institutions that use the futures market for speculative purposes and meet certain requirements.
- Long non-commercial positions represent the total long open position of non-commercial traders.
- Short non-commercial positions represent the total short open position of non-commercial traders.
- Total non-commercial net position is the difference between short and long positions of non-commercial traders.