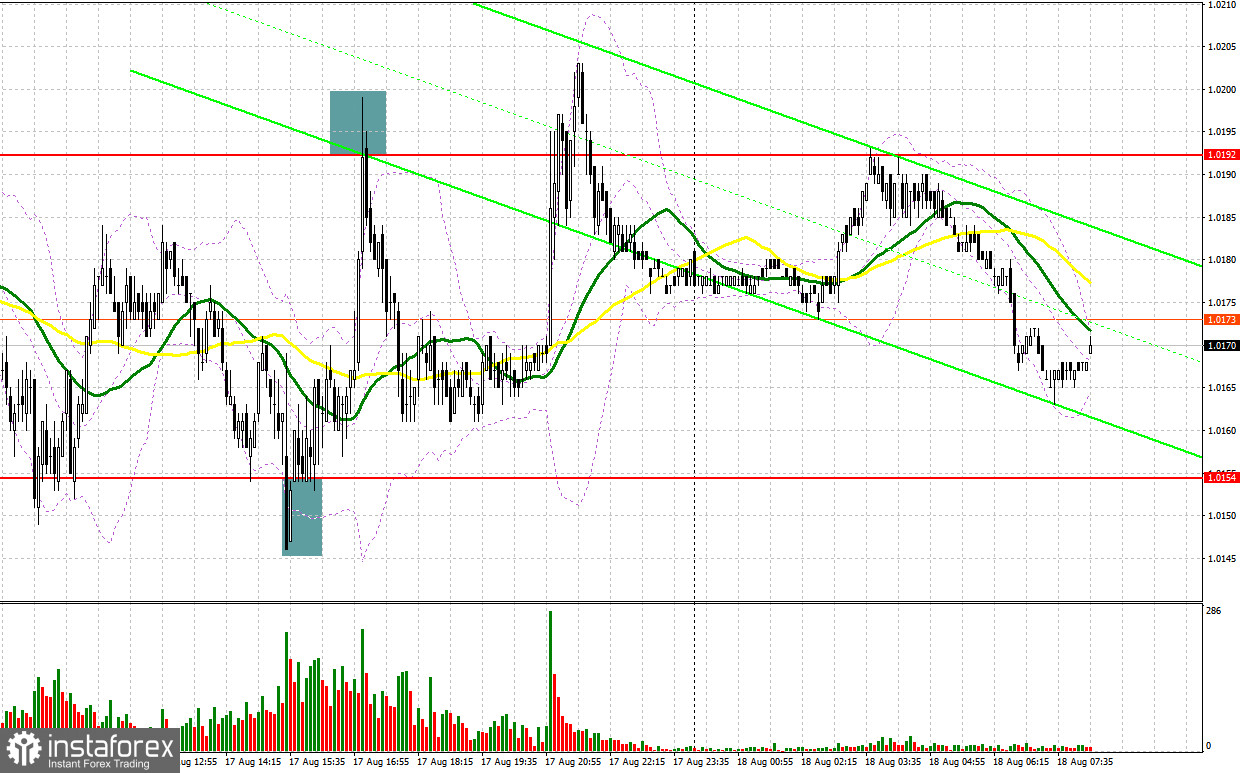
Several interesting market entry signals were formed yesterday. Let's take a look at the 5-minute chart and figure out what happened. I paid attention to the 1.0159 level in my morning forecast and advised that you make decisions on entering the market from it. The pair's decline in the area of 1.0159 in the first half of the day and the reverse test from above resulted in creating a sell signal, which, to my regret, brought losses, since I did not wait for the pair to fall further. In the afternoon, the decline to the 1.0154 area led to an excellent entry point for buying the euro and a sharp upward movement of more than 45 points, which made it possible to offset losses and make some money. An unsuccessful attempt to rise above 1.0192 and a false breakout at this level - all this led to a signal to sell the euro with a move down by 30 points.
When to go long on EUR/USD:
The minutes of the Federal Reserve meeting were released yesterday, where officials last month agreed on the need to eventually ease the pace of interest rate hikes, but before doing so, cited the need to assess how their monetary tightening is working to curb inflation in the US. As we remember, the US inflation data in July showed a slowdown in growth, which is quite good for determining the committee's future policy. However, there was absolutely no market reaction to the minutes. This suggests that there are fewer and fewer people willing to buy euros in the face of an impending recession in the economies of the eurozone and the United States. I recommend to put on the short position further along the medium-term trend and to update the parity. As for the short-term scenario, Data on inflation in the euro area will be released in the morning, which will certainly put pressure on the euro, which will be a good reason to build up short positions. From a technical point of view, little has changed: in case the pair falls, forming a false breakout in the area of 1.0155 will provide a signal to open long positions in the hopes that the pair would continue to recover with the prospect of updating the nearest resistance level of 1.0190, above which the bulls failed to break through yesterday. A breakthrough and downward test of this range from top to bottom will hit the bears' stop orders, forming another signal to enter longs with the possibility of updating 1.0221. The farthest target will be a new high at 1.0243, where I recommend taking profits.
If the EUR/USD falls and there are no bulls at 1.0155, and this level was already tested several times yesterday, the pressure on the pair will increase, and things will go badly for the euro bulls. The best option for opening long positions in this case would be a false breakout in the area of 1.0127. I advise you to buy EUR/USD immediately on a rebound only from 1.0099, or even lower - around the parity of 1.0045, counting on an upward correction of 30-35 points within the day.
When to go short on EUR/USD:
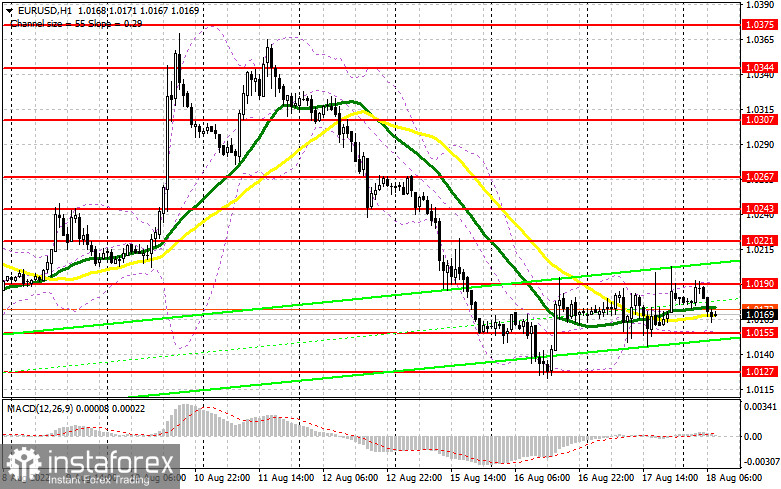
The bears' main task is to protect the major resistance level of 1.0190, as it has not been possible to go above this level for several days. If there really are bears, then it will not be difficult to protect this level. The optimal scenario for opening short positions would be a false breakout in the resistance area of 1.0190 after the eurozone inflation data is released, which will lead the euro to move down to 1.0155. Breakdown and consolidation below this range will not be long in coming, as it will be useless to resist in this case. The reverse test from the bottom up creates another sell signal with the removal of bulls' stop orders and a larger movement of the pair to the area of 1.0127. Consolidating below this area will completely cancel all of the bulls' plans to build an upward trend, which will open a direct road to 1.0099 and 1.0073, where I recommend completely exiting short positions. A more distant target will be the area of 1.0045.
In case EUR/USD moves up during the European session, as well as the absence of bears at 1.0190, the situation may change slightly in favor of the bulls. In this case, I advise you to postpone short positions until 1.0221, but only if a false breakout is formed there. You can sell EUR/USD immediately for a rebound from the high of 1.0243, or even higher - from 1.0267, counting on a downward correction of 30-35 points.
COT report:
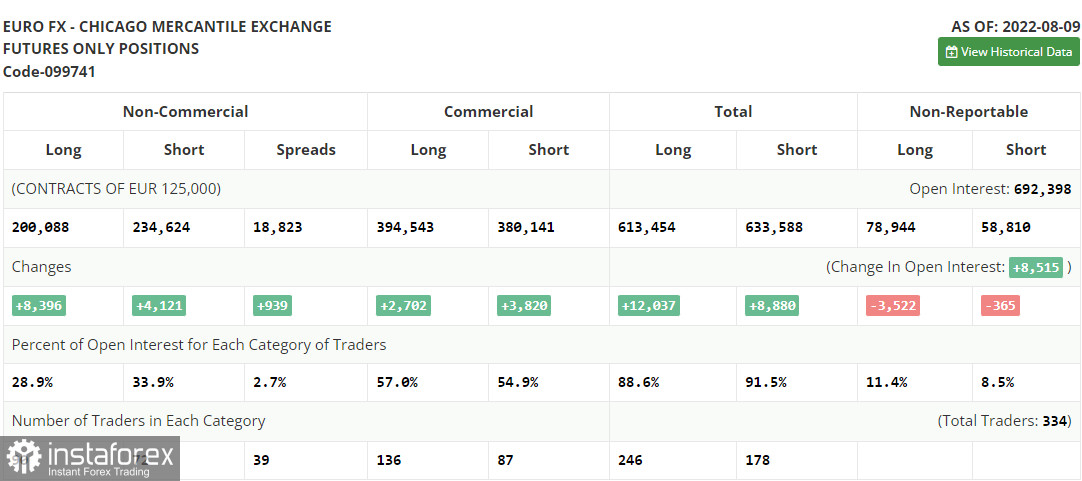
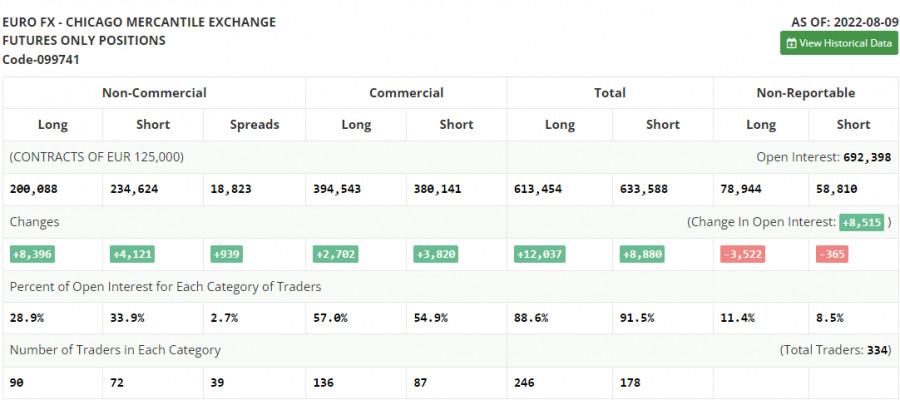
The Commitment of Traders (COT) report for August 9 logged a sharp increase in both short and long positions, but the former turned out to be more, which continues to indicate the gradual end of the bear market and an attempt to find a market bottom after reaching euro parity against the US dollar. Statistics on inflation in the US came out last week, which turned everything upside down. The first slowdown in inflationary pressure in recent times since reaching a peak of 10.0% has brought back demand for risky assets. But, as you can see on the chart, it didn't last long. The risk of deterioration of the situation associated with the recession of the global economy discourages traders and investors from any desire to build up long positions in the euro. There are no important reports this week that can help the euro regain lost ground, so I would recommend betting more on trading on the horizontal channel. Definitely, before the fall of this year, we can hardly expect serious market shocks. The COT report shows that long non-commercial positions rose by 8,396 to 200,088, while short non-commercial positions jumped by 4,121 to 234,624. At the end of the week, the overall non-commercial net position remained negative, but slightly increased from -39,811 to -34,536, which indicates a continuation of the market turning towards euro bulls. The weekly closing price increased and amounted to 1.0233 against 1.0206.
Indicator signals:
Moving averages
Trading is carried out in the area of 30 and 50-day moving averages, which indicates the market equilibrium, playing on the bears' side, as the trend is downward.
Note: The period and prices of moving averages are considered by the author on the H1 hourly chart and differs from the general definition of the classic daily moving averages on the daily D1 chart.
Bollinger Bands
In case of a decline, the lower border of the indicator around 1.0155 will act as support. In case of growth, the upper border of the indicator in the area of 1.0190 will act as resistance.
Description of indicators
- Moving average (moving average, determines the current trend by smoothing out volatility and noise). Period 50. It is marked in yellow on the chart.
- Moving average (moving average, determines the current trend by smoothing out volatility and noise). Period 30. It is marked in green on the chart.
- MACD indicator (Moving Average Convergence/Divergence — convergence/divergence of moving averages) Quick EMA period 12. Slow EMA period to 26. SMA period 9
- Bollinger Bands (Bollinger Bands). Period 20
- Non-commercial speculative traders, such as individual traders, hedge funds, and large institutions that use the futures market for speculative purposes and meet certain requirements.
- Long non-commercial positions represent the total long open position of non-commercial traders.
- Short non-commercial positions represent the total short open position of non-commercial traders.
- Total non-commercial net position is the difference between short and long positions of non-commercial traders.